Integrations
speedtest-z sends results to every enabled backend: Zabbix, Grafana Cloud, and any OTLP endpoint.
Zabbix Integration
- Import the
speedtest-z_templates.yamltemplate into Zabbix. - All items are trapper type -- the agent pushes data to Zabbix using the zappix sender protocol.
- Set
enable = truein the[zabbix]section ofconfig.ini. - The
hostvalue inconfig.inimust match the host name registered in Zabbix.
Grafana Cloud Integration
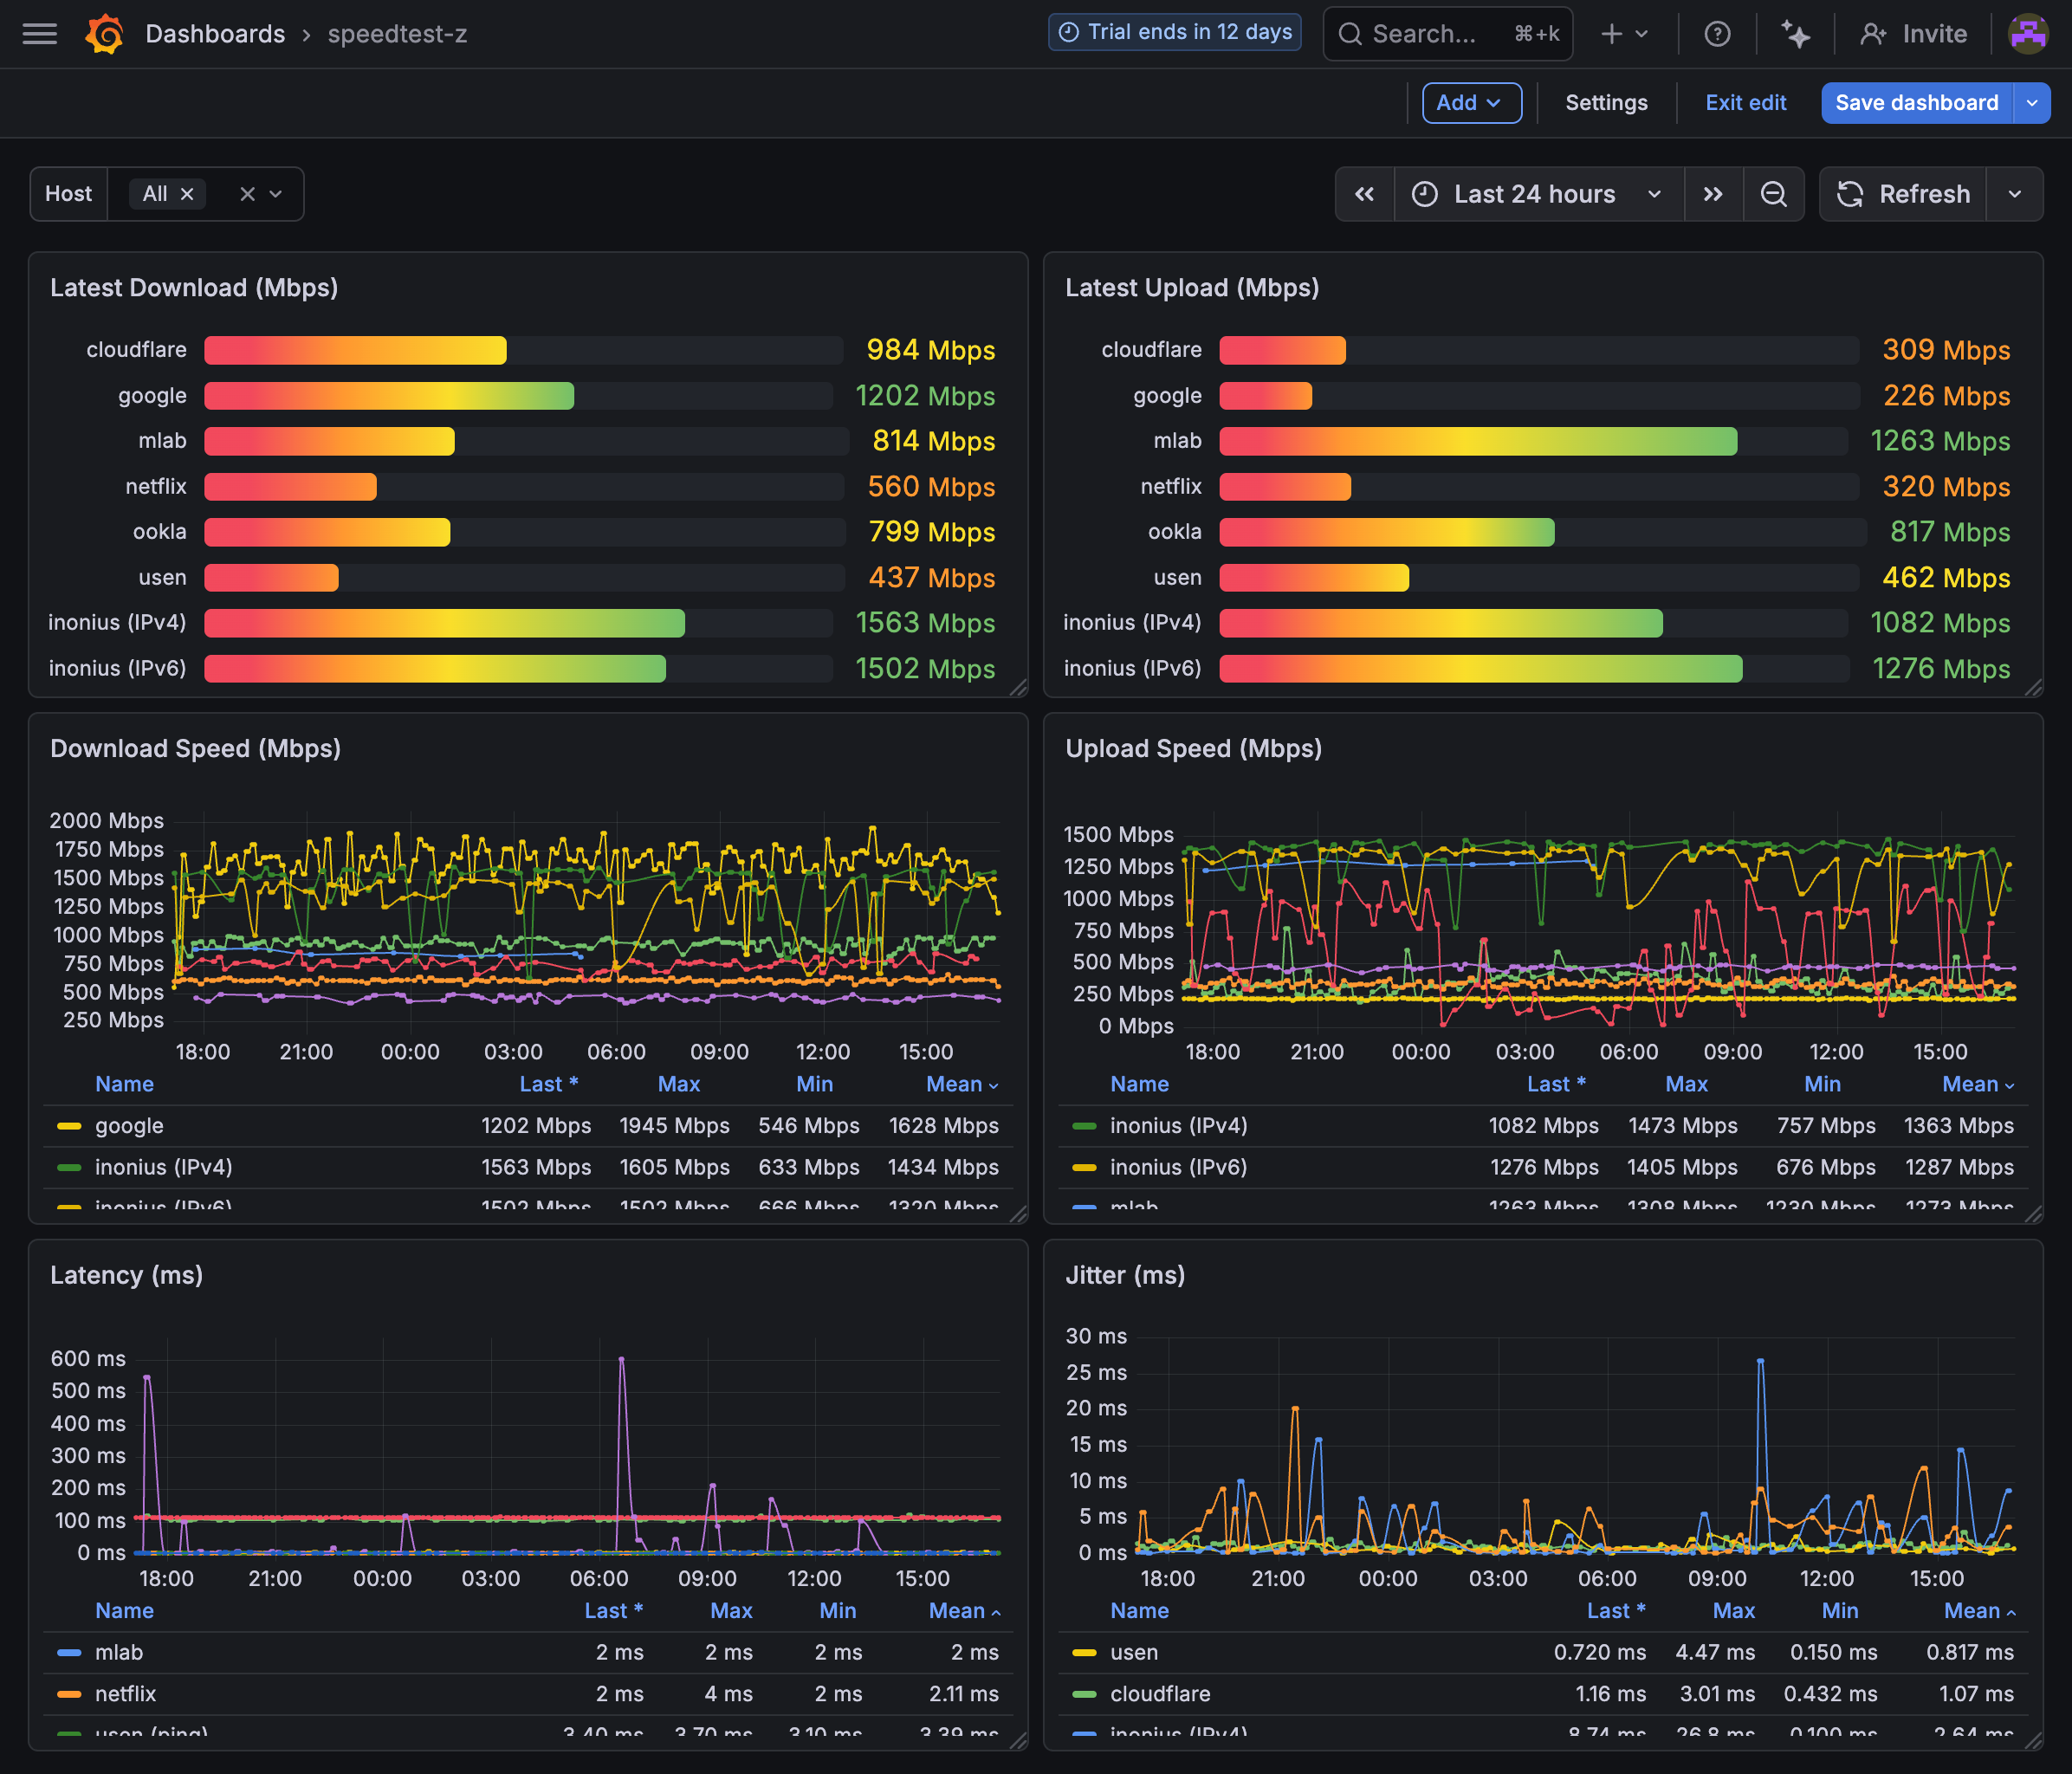
speedtest-z can push metrics to Grafana Cloud via Prometheus Remote Write.
- Install with Grafana support:
pip install speedtest-z[grafana] - Add the
[grafana]section toconfig.ini:
[grafana]
enable = true
remote_write_url = https://prometheus-prod-XX-prod-XX.grafana.net/api/prom/push
username = <your-prometheus-username>
token = <your-grafana-cloud-api-token>
- Metrics are sent as
speedtest_<metric>with asitelabel (e.g.,speedtest_download{site="cloudflare"}). - Both Zabbix and Grafana can be enabled simultaneously -- results are sent to all enabled backends.
OpenTelemetry (OTLP) Integration
speedtest-z can export metrics via OpenTelemetry Protocol (OTLP) to any OTLP-compatible backend.
- Install with OTel support:
pip install speedtest-z[otel] - Add the
[otel]section toconfig.ini:
[otel]
enable = true
endpoint = https://otlp-gateway-prod-XX.grafana.net/otlp
headers = Authorization=Basic <base64-encoded-credentials>
- Metrics are sent as
speedtest_<metric>withsiteandhostlabels. - All three backends (Zabbix, Grafana, OTel) can be enabled simultaneously.
Note: As of Feb 2026, direct OTLP metrics ingestion (without a collector) on free tier accounts is supported by very few backends. Grafana Cloud is the most mature option. Mackerel, GCP Cloud Monitoring, and AWS CloudWatch currently support OTLP traces only; Datadog requires an allowlisted organization. Paid plans may offer broader OTLP metrics support.