Tools
A user-facing tour of what jquants-mcp lets Claude do. For exact parameter tables and endpoint mappings, see the GitHub README.
Asking the right way
You don't have to memorise tool names — Claude picks the right one from your question. The examples below show queries that map cleanly to a single tool; Claude can also chain several tools (e.g. screen for top movers, then chart the leader) without you having to ask.
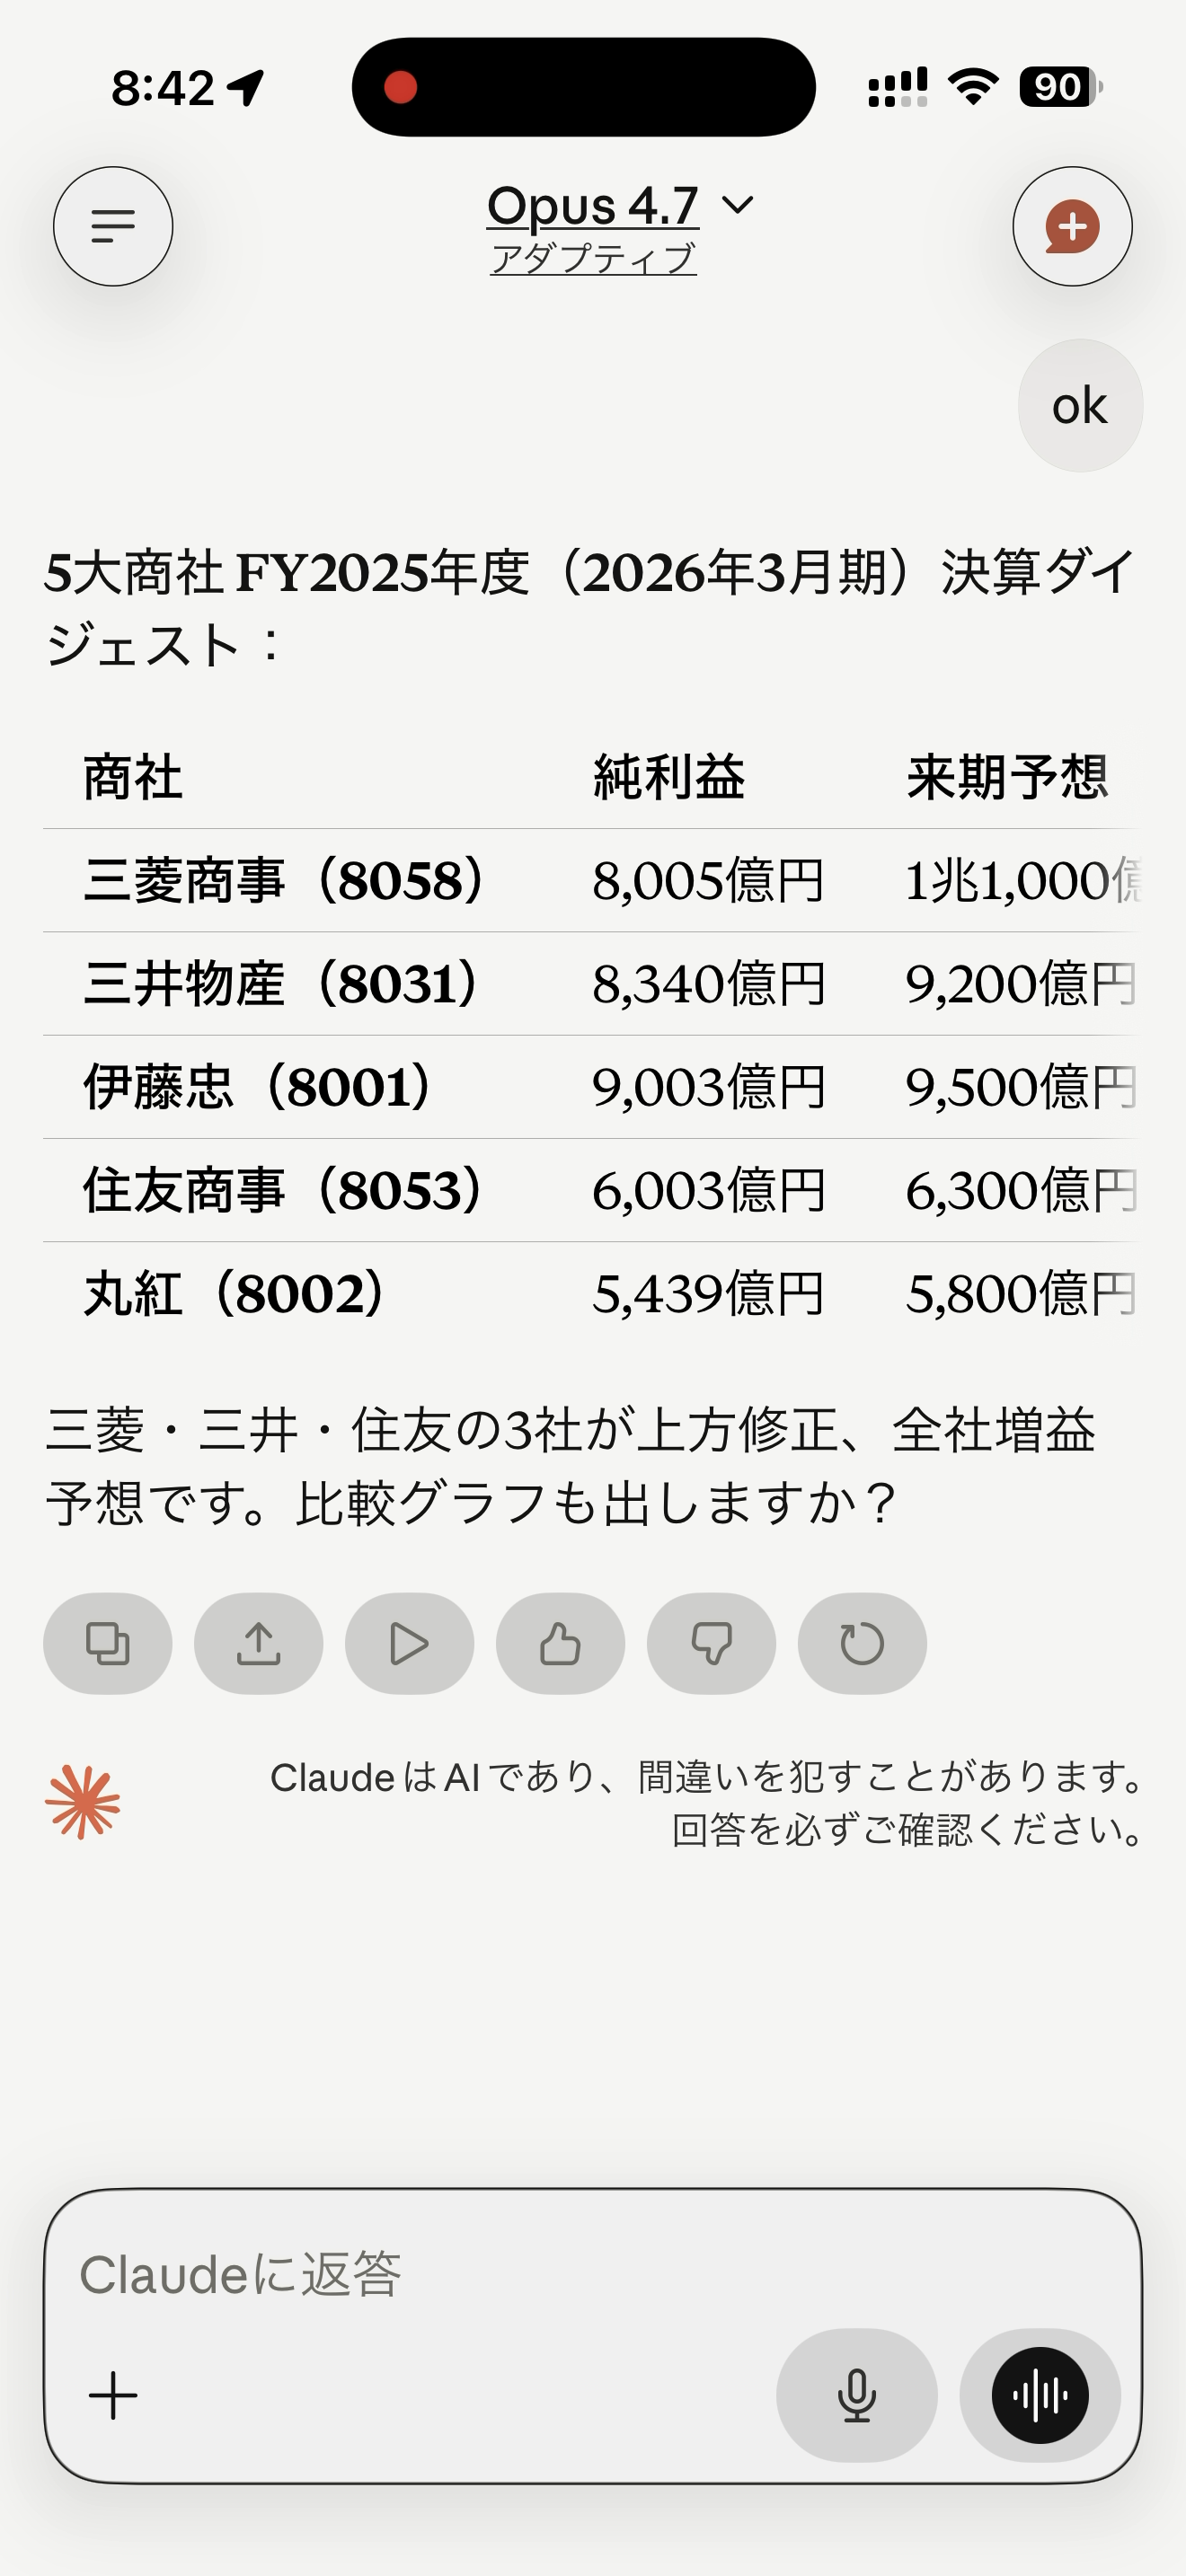
Daily market overview & valuation
What's the market doing today, and which sectors look cheap?
| Question | Tool |
|---|---|
| "How many stocks advanced vs declined today?" | detect_price_change |
| "25-day advance/decline ratio" | get_advance_decline_ratio |
| "Top 10 gainers today" | get_top_movers |
| "Volume ranking" | get_top_volume |
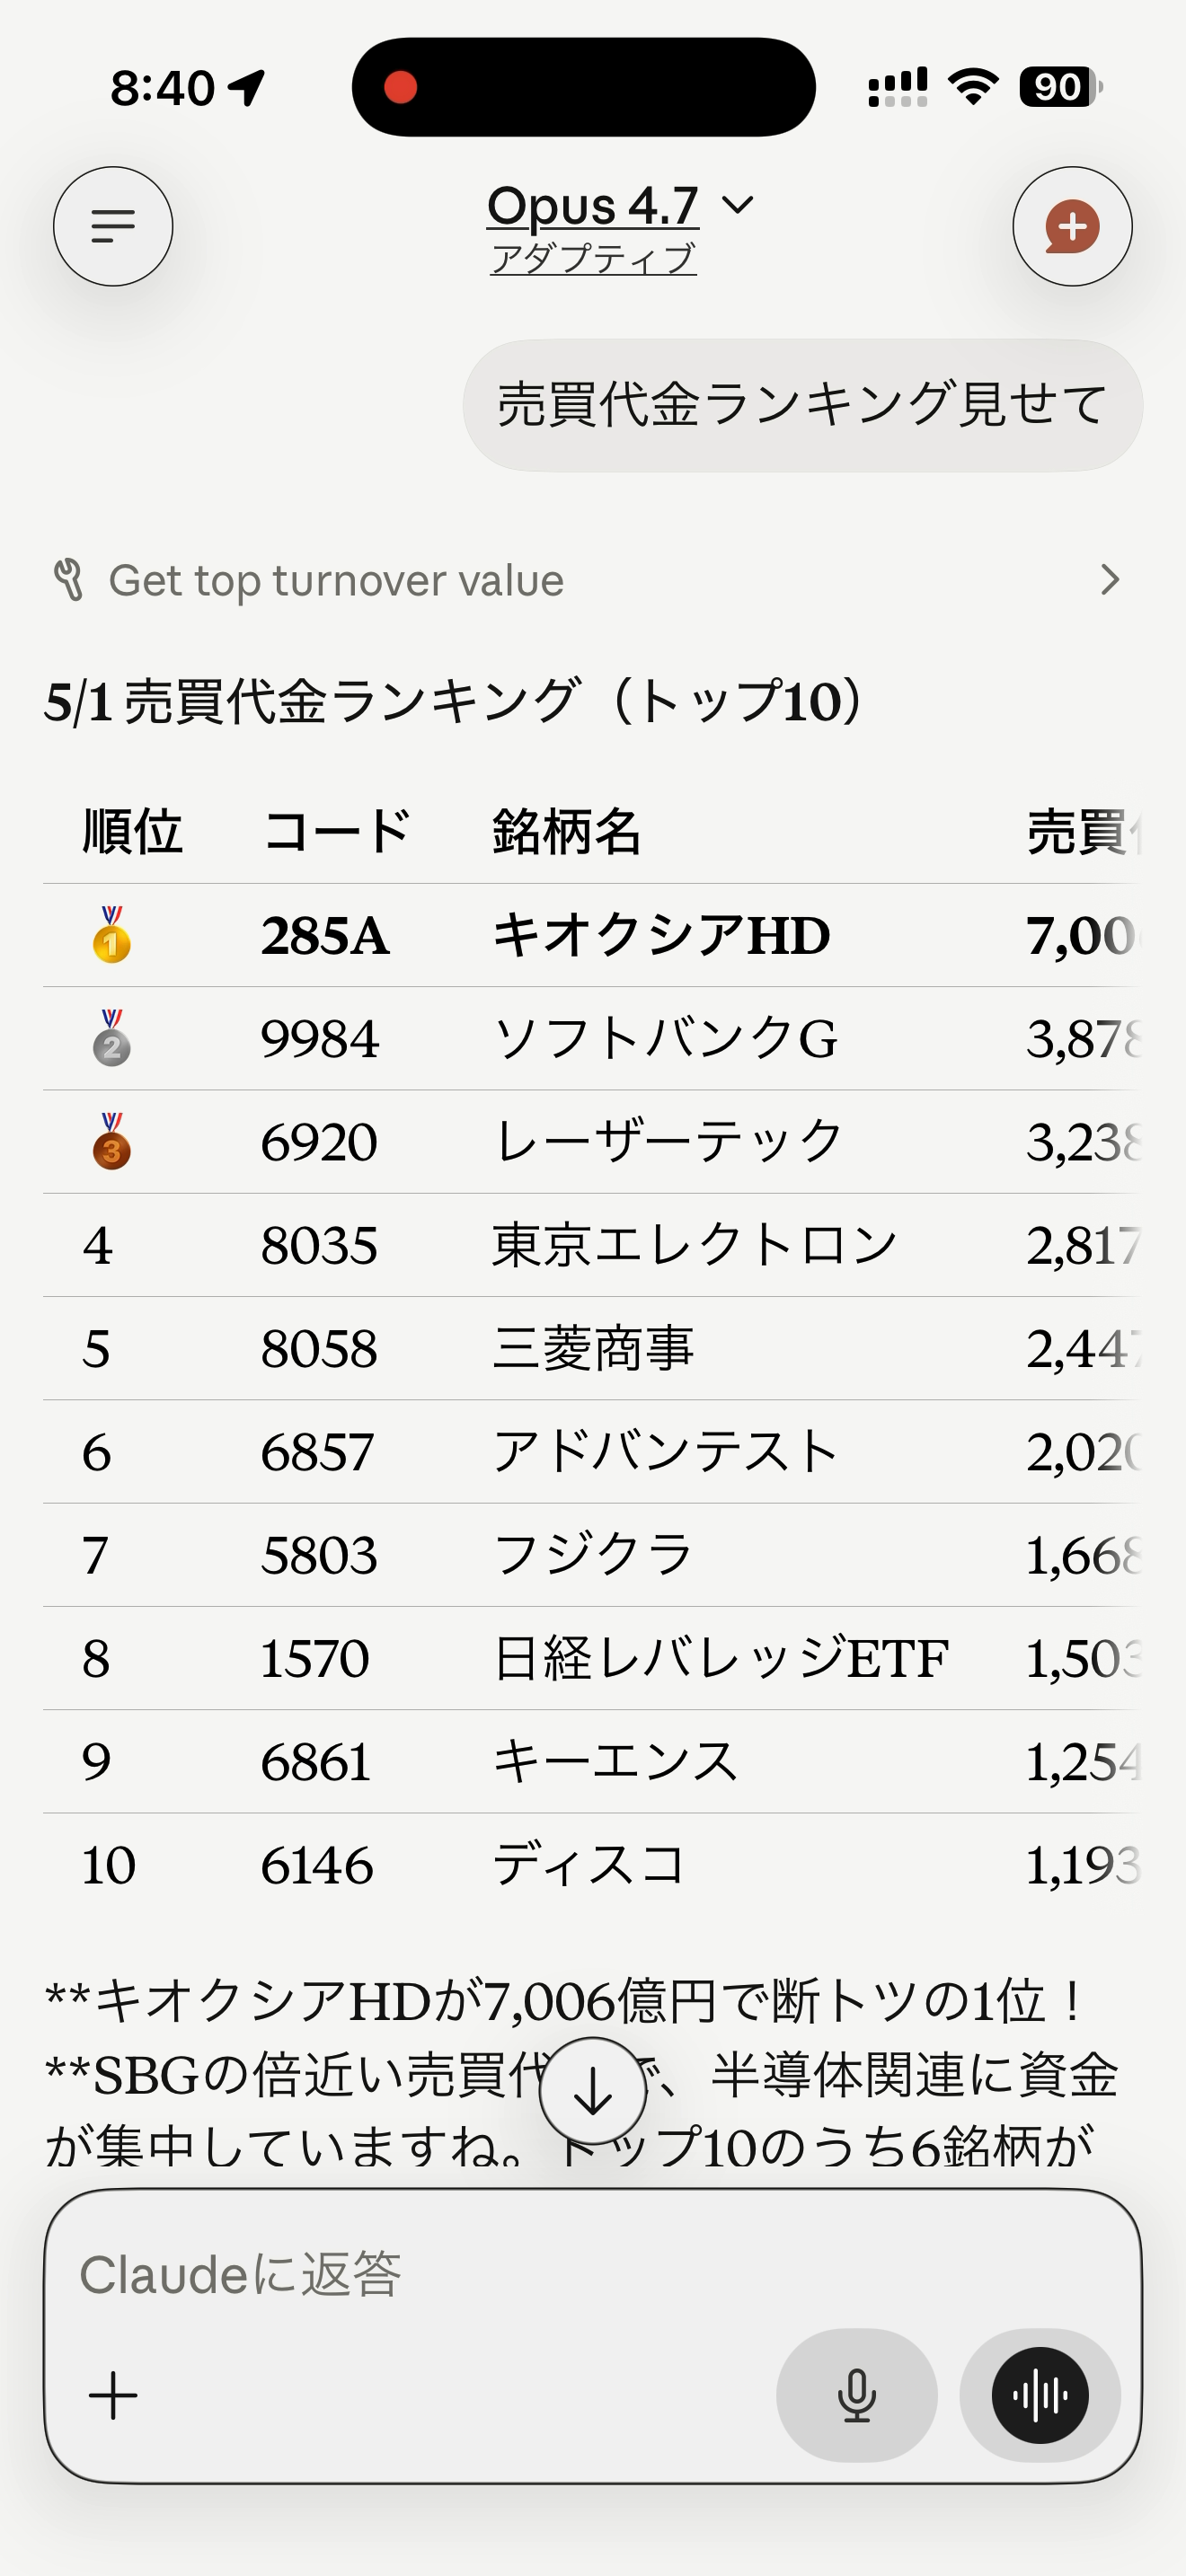
| "Turnover value ranking" (yen-based, institutional flow) | get_top_turnover_value |
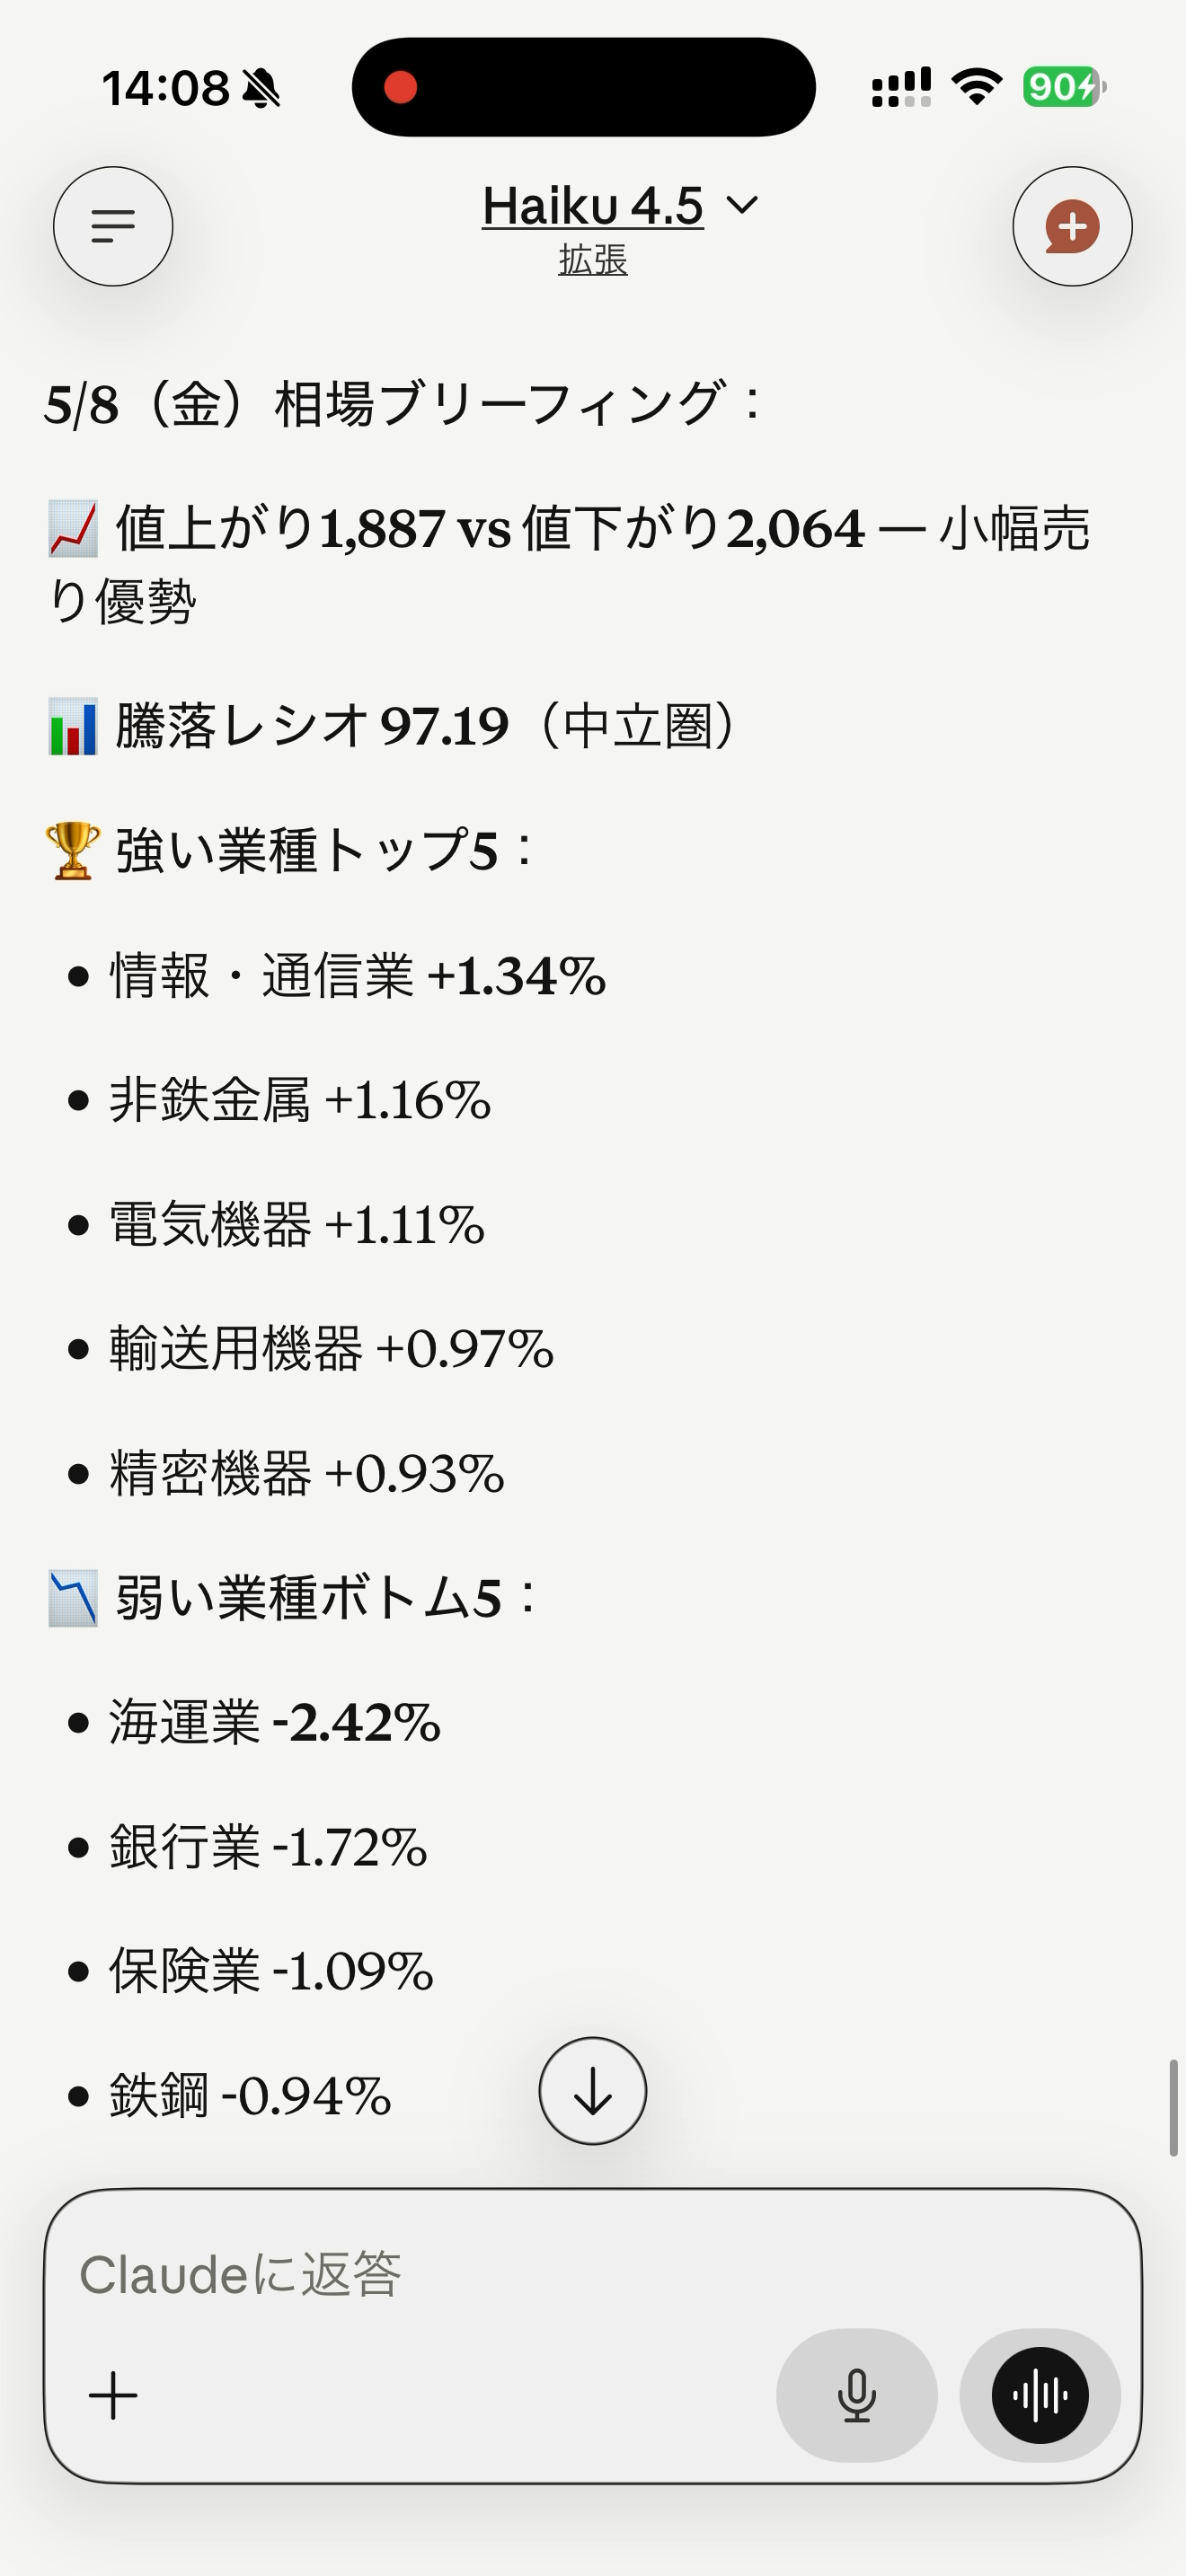
| "Sector performance today" (TSE 33 sectors or 17 sectors) | get_sector_performance |
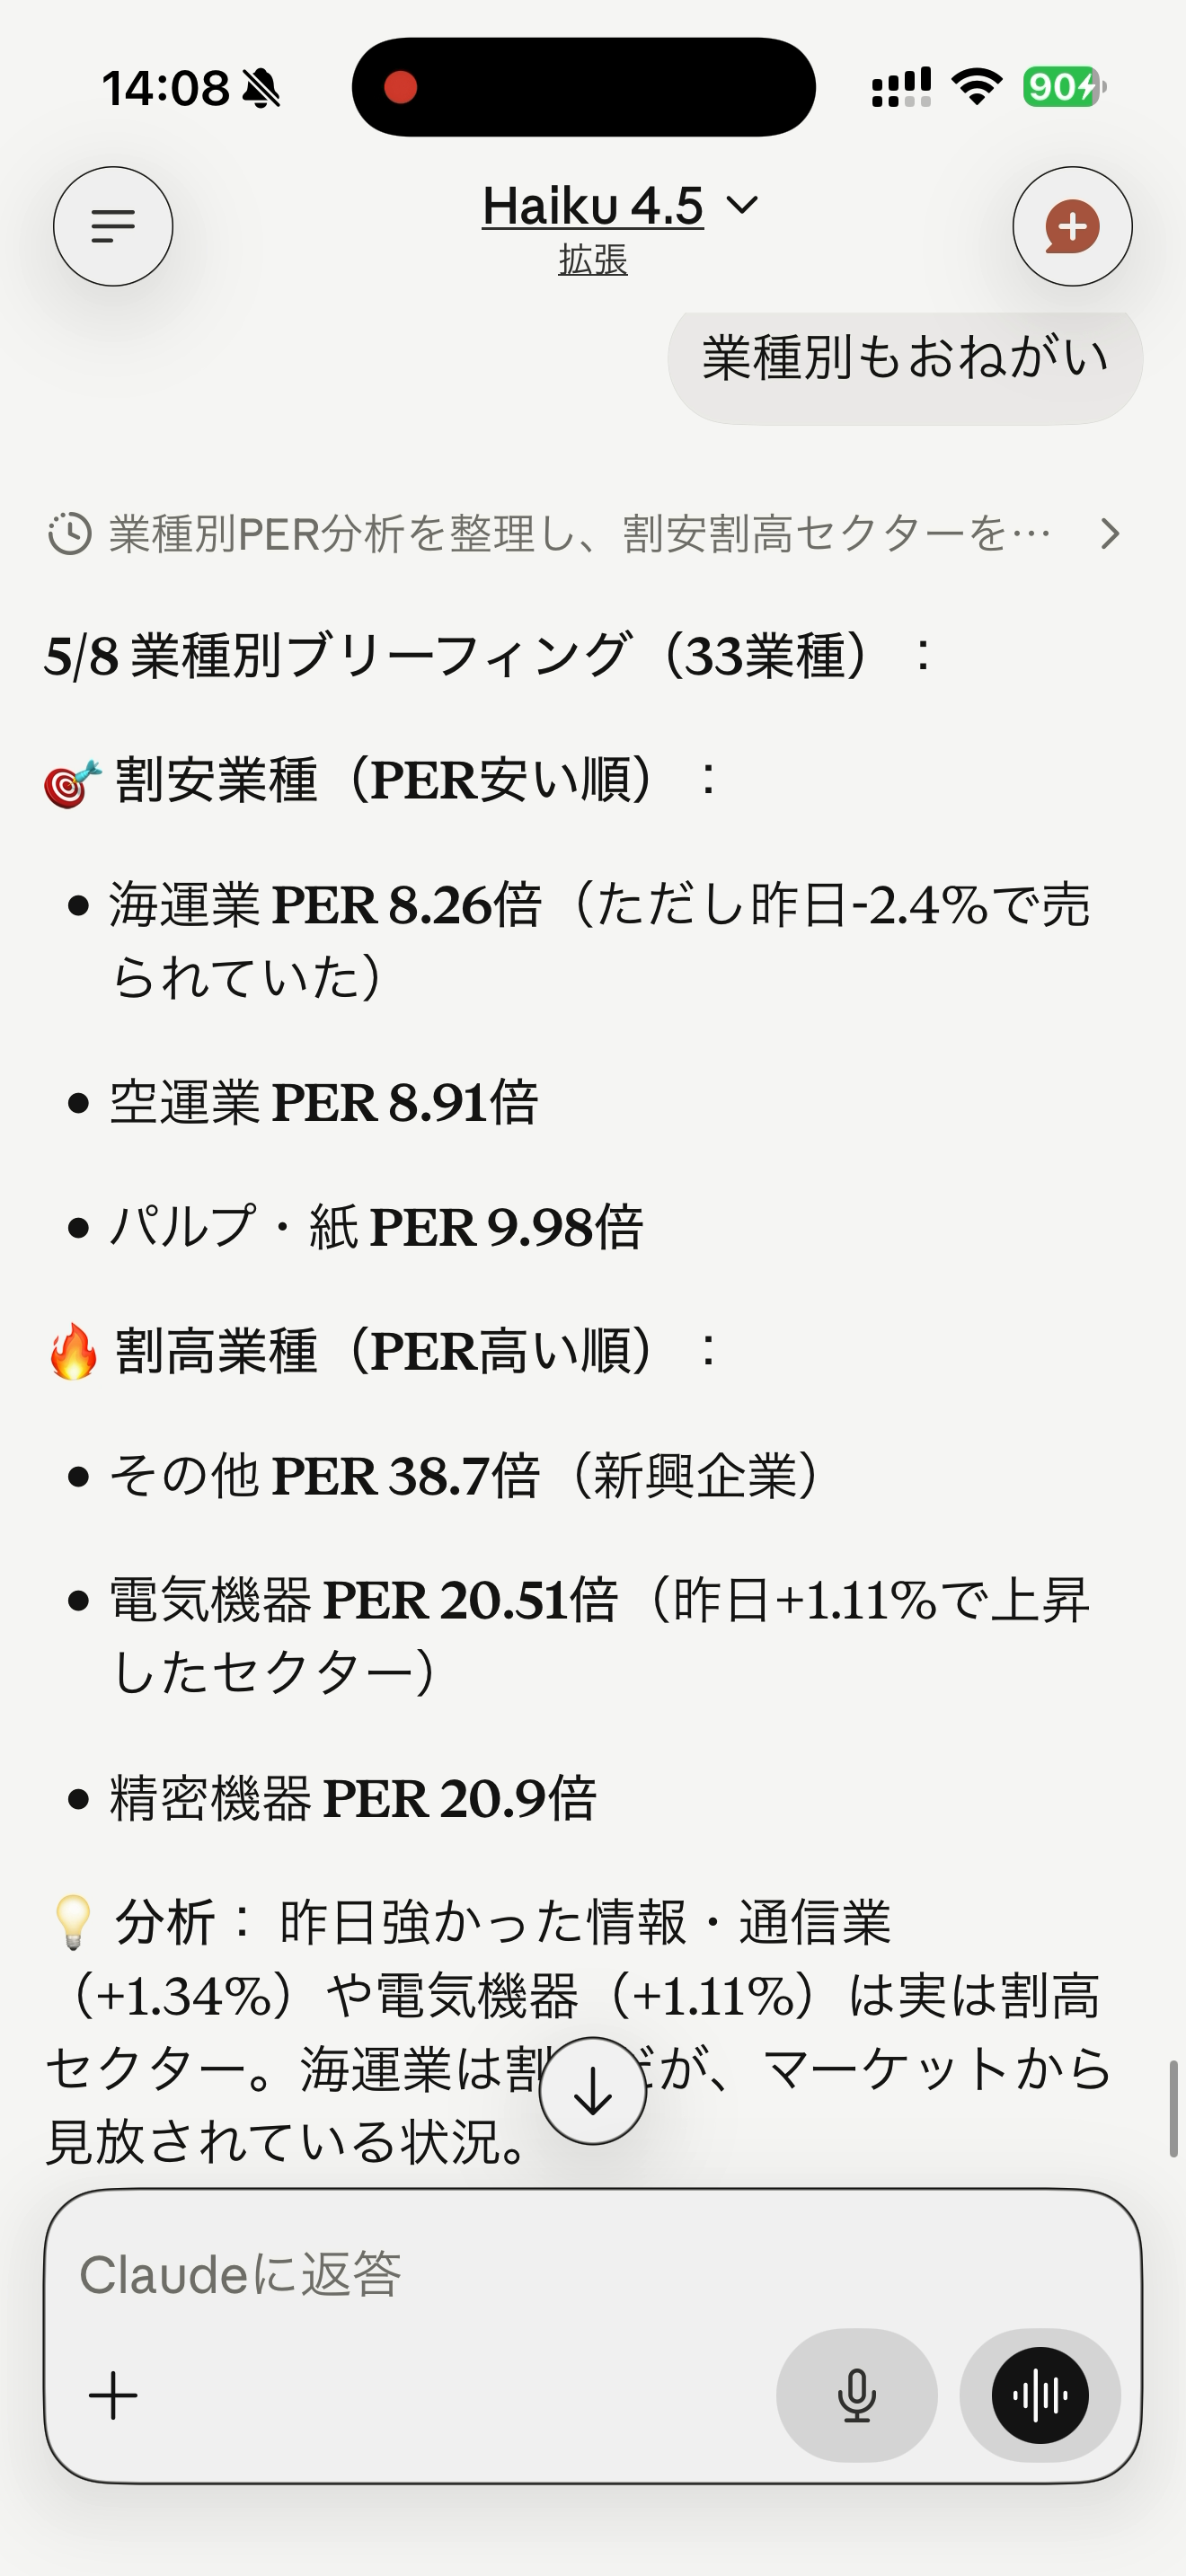
| "Sector PER/PBR/ROE — which sectors look cheap?" | get_sector_briefing |
| "Cheapest stocks by PER / PBR" | get_valuation_ranking |
| "High dividend yield ranking" | get_dividend_yield_ranking |
| "Today's market briefing" (one-call composite — advance/decline + ADR + sectors + rankings + TOPIX change + screener highlights + distribution-day + follow-through-day signal) | get_market_briefing |
These all run against the local cache — no API call, no rate limit.
One-call briefings
Ask for a morning brief and Claude returns a composite narrative — market overview, sector valuation, or single-stock detail — without you having to chain multiple tools:
| Question | Tool |
|---|---|
| "Today's market briefing" | get_market_briefing |
| "Sector PER/PBR/ROE — cheapest first" | get_sector_briefing |
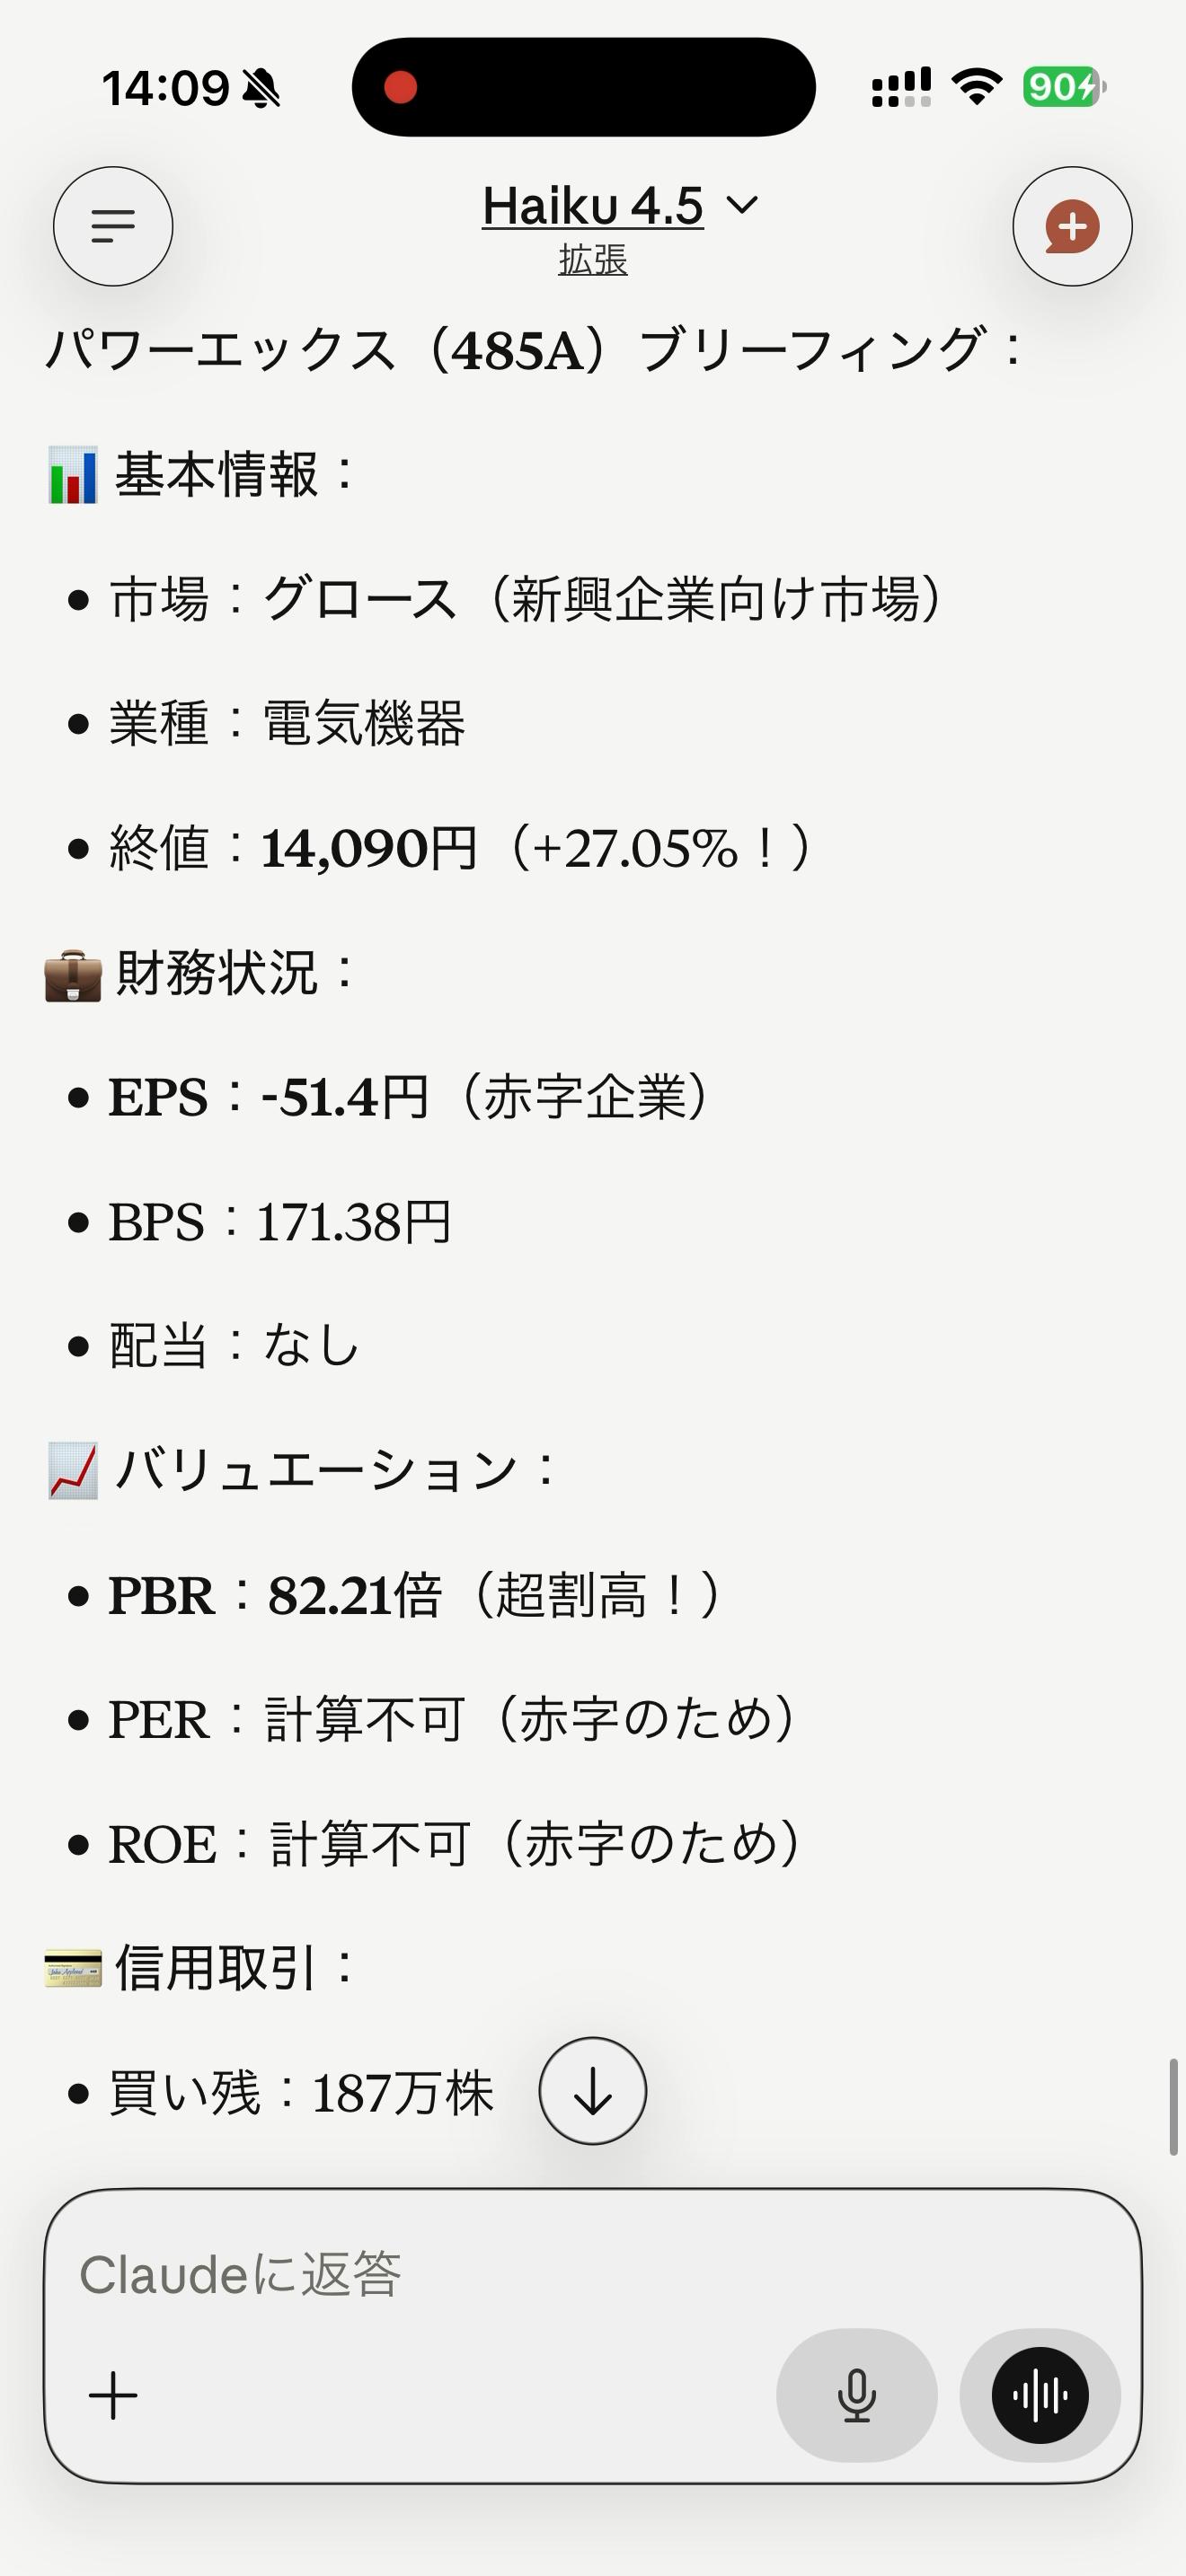
| "485A stock briefing" | get_stock_briefing |
Per-stock data
Drill into a specific code:
| Question | Tool |
|---|---|
| "8053 (Sumitomo Corp) — price, financials, and PER at a glance" | get_stock_briefing |
| "7203 (Toyota) — past month daily prices" | get_equities_bars_daily |
| "8053 Sumitomo Corp earnings summary" | get_fins_summary |
| "9984 SoftBank dividend history" | get_fins_dividend |
| "285A (Kioxia) — 3-month candlestick chart" | get_candlestick_data |
| "7203 SMA25 above or below? RSI?" | get_technical_indicators |
| "What's the code for Sumitomo Corp?" | search_equities |
get_candlestick_data defaults to a 91-day window with volume + sma5 + sma25
overlays and returns JSON for React artifact rendering. SMAs are warmed up from
earlier bars so the moving averages are fully populated from the first displayed
candle. RSI is not yet available as a chart indicator — use
get_technical_indicators for numeric RSI values.
get_technical_indicators returns SMA (5/25/75), Bollinger Bands (bb20), and
RSI (rsi14) as numeric values — useful when you want to ask "is the close above
SMA25?" or "is RSI in overbought territory?" without rendering a chart.
All values use split-adjusted close so results are consistent across stock splits.
Screening
Find stocks matching a signal:
| Question | Tool |
|---|---|
| "Stocks hitting new year-to-date highs" | detect_ytd_high_low |
| "Stocks hitting new 52-week highs" | detect_52w_high_low |
| "Stocks at daily price limit (ストップ高/安)" (close vs. locked-limit breakdown) | detect_price_limit |
| "Stocks with volume 2× the 20-day average" | detect_volume_surge |
| "Stocks that closed above VWAP" | compare_close_vs_vwap |
| "Is the market under distribution? (機関投資家の売り圧力)" | detect_distribution_days |
| "Did the current rally get a follow-through day confirmation?" | detect_follow_through_day |
detect_distribution_days uses TOPIX as the market proxy and total market
turnover (SUM(Va)) as the volume signal. A distribution day fires when TOPIX
falls ≥ 2.0 σ below the 20-session rolling mean (same window as BB20). Four or
more within 25 sessions is a warning that the uptrend may be failing (IBD —
Investor's Business Daily, a US investment research publication that
developed this distribution-day methodology — method adapted for TOPIX,
calibrated against 2021–2026 data, fires ~9 times/year at the default
threshold). Each entry includes volume_confirmed (whether total market Va
exceeded the prior session).
detect_follow_through_day confirms a new uptrend: TOPIX must rise ≥ 2.0 σ on
session 4 or later from rally_start (the low/reversal day) with higher market
volume. Provide the first day of the rally attempt as rally_start; check
each subsequent date until the signal fires or distribution resumes.
Both signals are also embedded automatically in get_market_briefing under the
trend_signals key — the briefing auto-detects the potential rally start as the
TOPIX 30-session low, so you get distribution + follow-through status in a
single call without specifying rally_start manually.
detect_ytd_high_low and detect_52w_high_low now include four extra fields per
match: AdjO (split-adjusted open, for candle direction), close_vs_vwap
("above" / "below", comparing the raw close against the daily VWAP Va/Vo),
volume_ratio (today's volume divided by the 20-session average — values above
1.5 suggest conviction), and volume_ratio_sessions (the actual number of
sessions used in the baseline, which can be fewer than 20 near year-start).
Together these let you ask "was the new high confirmed by a bullish candle with
above-average volume, closing above VWAP?" without rendering a chart.
All screeners are pure-Python over the cached daily bars — no extra API calls even for full-universe scans.
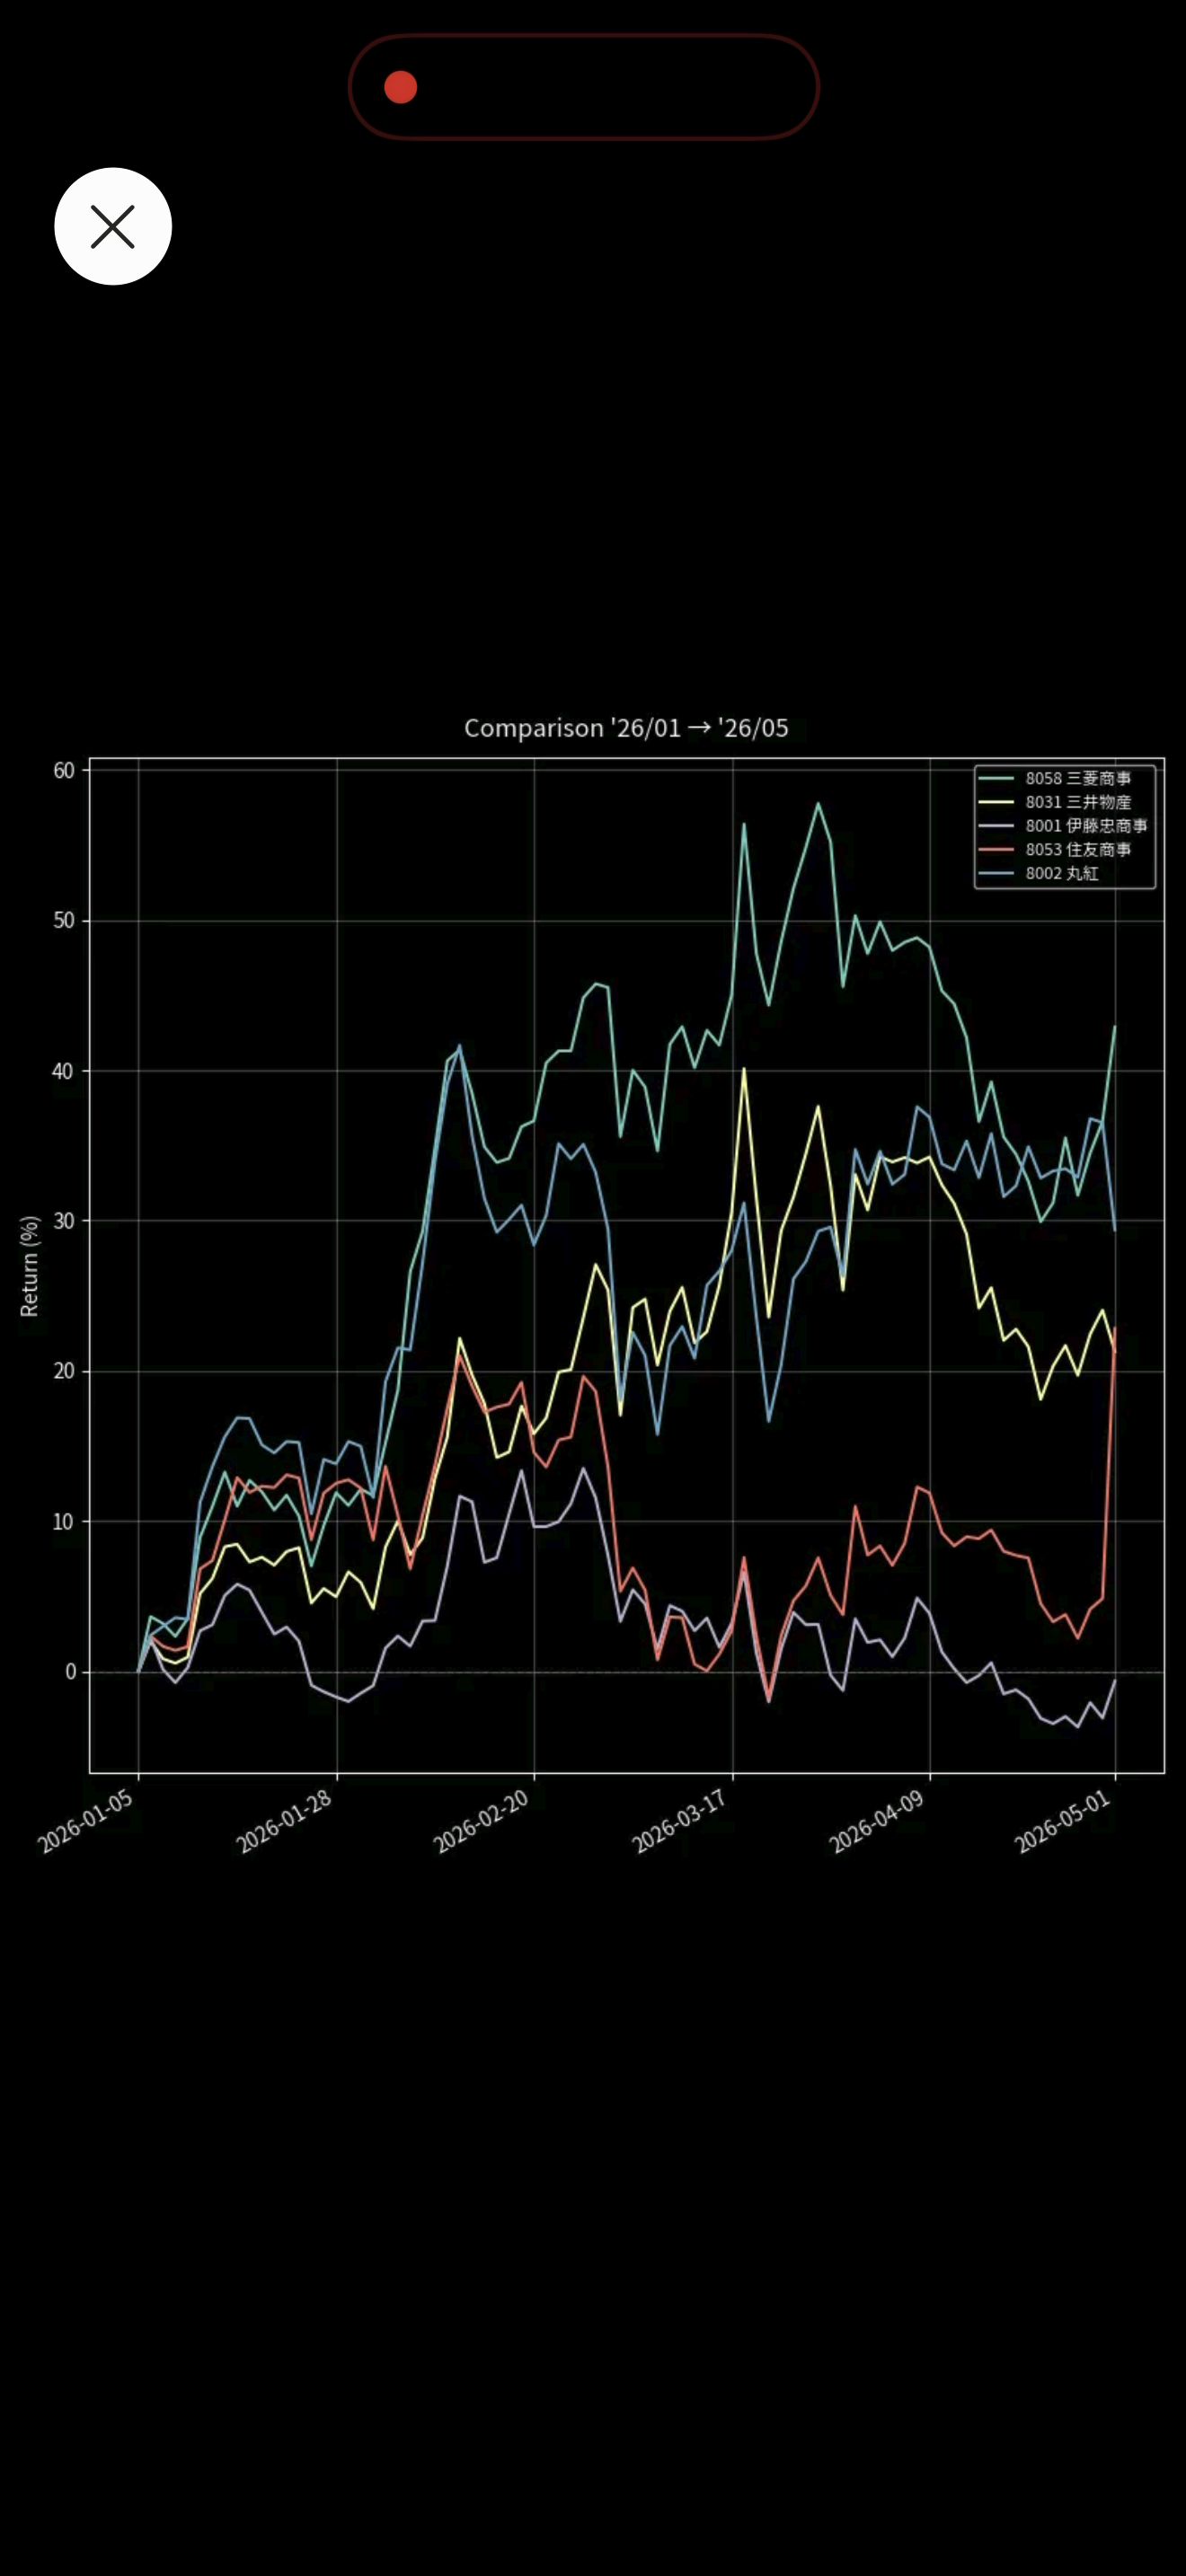
Comparison charts
Side-by-side return comparison for up to 10 codes:
Compare year-to-date returns for the five major trading houses (8001 8002 8031 8053 8058)
Claude calls render_comparison_chart with mode="return_pct" (the default),
producing a return chart with each series normalised to 0% at the first bar.
Add mode="price" if you want the raw split-adjusted close instead.
Investor positioning (Standard plan and above)
| Question | Tool |
|---|---|
| "Investor-type turnover breakdown" | get_equities_investor_types |
| "Short-sale ratio by sector" | get_markets_short_ratio |
| "Margin trading balance" | get_markets_margin_interest |
| "Stocks under additional margin requirement" | get_markets_margin_alert |
Calendar and reference
| Question | Tool |
|---|---|
| "Earnings announcements this week" (upcoming schedule) | get_earnings_this_week |
| "Earnings results disclosed this week" (actual numbers) | get_earnings_results_this_week |
| "Next earnings date for one stock" | get_equities_earnings_calendar |
| "Public holidays next week" | get_markets_calendar |
| "Listed equities master list" | get_equities_master |
Utility / admin
| Question | Tool |
|---|---|
| "Server health status" | health_check |
| "Cache statistics" | cache_status |
| "Clear the cache" | cache_clear |
The full list of 47 tools (with endpoints, plan requirements, and parameter tables) is on the Available Tools section of the GitHub README.