Quickstart
Get jquants-mcp answering Japanese stock questions in Claude in about 5 minutes.
Prerequisites
- Python 3.10 or newer (
python3 --version) - A J-Quants account with at least the Free plan (Light or above unlocks daily bars beyond the 12-week delay)
- One of: Claude Code (CLI), Claude Desktop, or any MCP-aware client
1. Install jquants-mcp
2. Get your J-Quants API key
The easiest way is the built-in browser login (PKCE flow):
This opens the J-Quants OAuth page; after approving, the API key is saved
to ~/.config/jquants-mcp/config.ini (mode 0600). Run jquants-mcp logout
to clear it.
If you prefer to manage the key yourself, copy it from the J-Quants dashboard and put it in the same file:
JQUANTS_API_KEY env var also works if you would rather not write a config file.
3. Connect to Claude
- Open claude.ai and create a Project (left sidebar → Projects → New project).
- Open the project → gear icon → Integrations → Add integration → Custom → enter the URL of your jquants-mcp server (e.g. a Cloud Run deployment). Authenticate with Google OAuth.
- (Optional but recommended) Click Add instructions and paste
the contents of
docs/claude-project-instructions.md. This teaches Claude how to render React artifact charts from the tool output without extra prompting. - The project settings (including the MCP connection) sync automatically to the Claude mobile app within a few minutes.
Verify with claude mcp list. The next time you launch claude, the
server is available.
4. Try it out
Open Claude and ask:
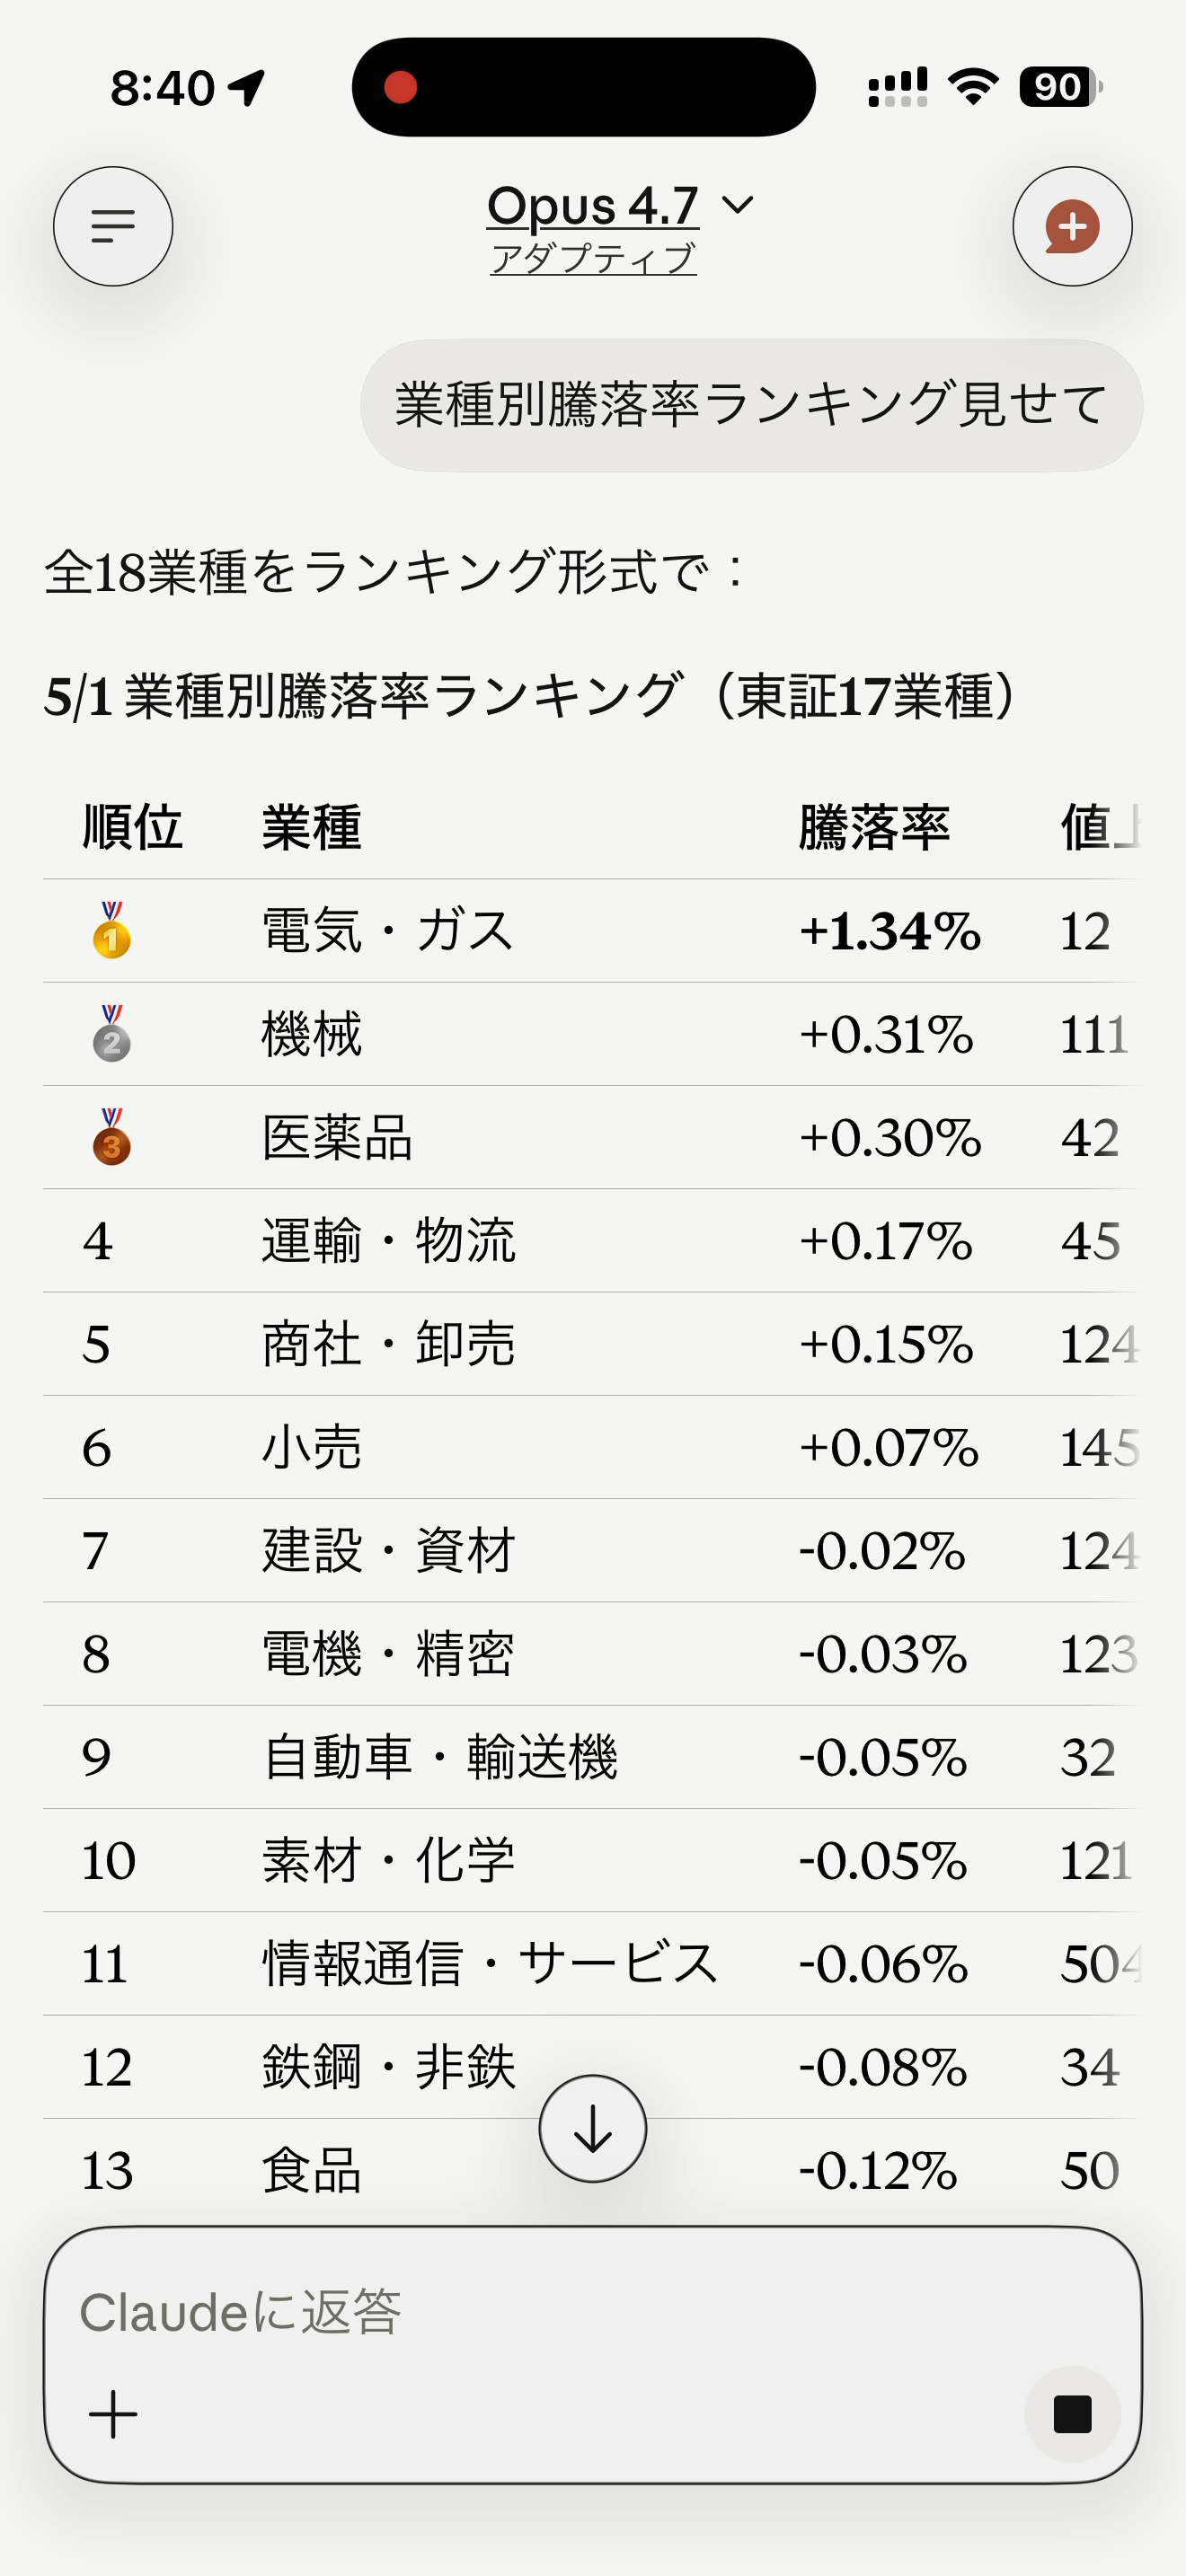
今日の業種別騰落率を教えて
Claude calls get_sector_performance and returns a ranked sector table. The
first call seeds the local cache; subsequent queries are instant.
Try a chart:
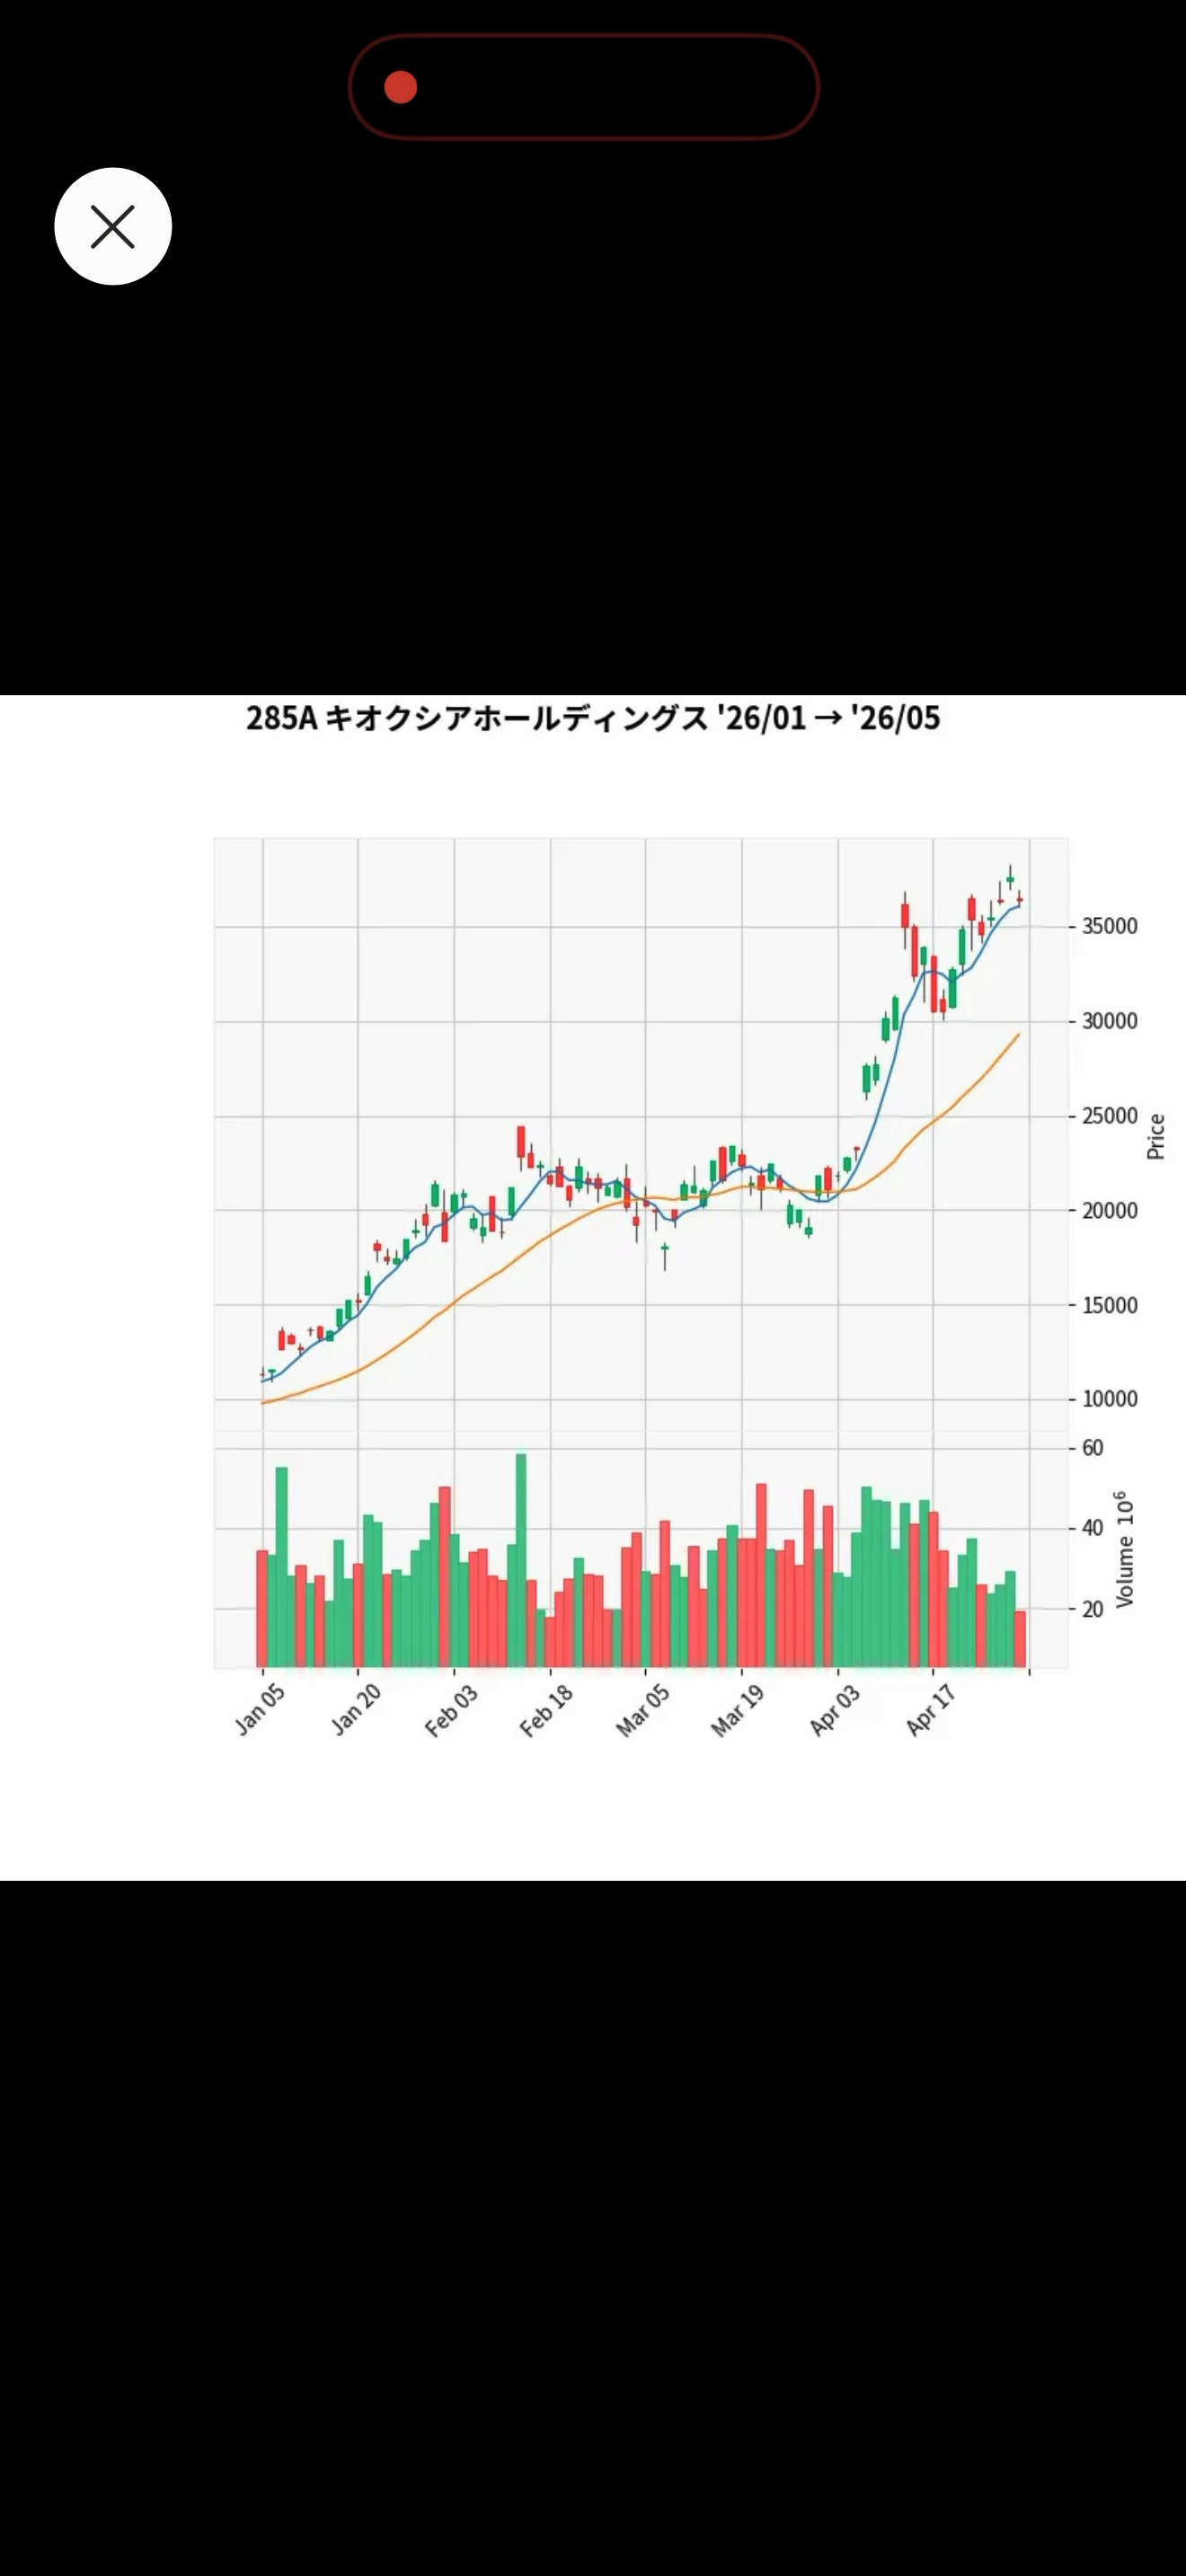
キオクシア(285A)のチャートを 3 か月分
Claude calls get_candlestick_data and renders a candlestick React artifact inline.
Next steps
- Tools → — what else you can ask Claude to do.
- FAQ → — common errors, plan recommendations, multi-user mode.
- Full reference: GitHub README covers config schema, deployment shapes (Docker / Cloud Run / self-hosted HTTP), per-tool parameter tables, and OAuth.